


| Count records by one fieldExample: number of students by grade, school, Case Manager, or Plan Type. | Compare two fieldsUse a Matrix when two dimensions are easiest to compare across rows and columns. |
| Compare three or more fieldsUse a Table to expose unusual combinations across a population. | Count or total service dataFilter by Service Code or total daily/monthly service minutes. |
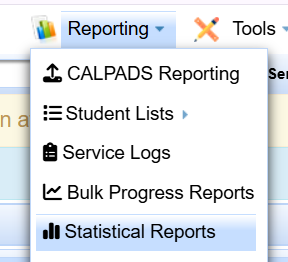
Statistical Reports count and group records rather than displaying one row per student.
Found Set First
Statistical Reports run on the records currently selected in SIRAS. If you previously ran a search, only that Found Set will be included unless you deliberately change or reset it.
- Decide which population the report is supposed to describe.
- If you need the full available population, use Reset Search before generating the report.
- If you need a specific population, build that Found Set first with Search Help.
- If the Found Set changes while you remain in Statistical Reports, use Refresh.

Reset the search when you want the report to use the full available population instead of a filtered Found Set.
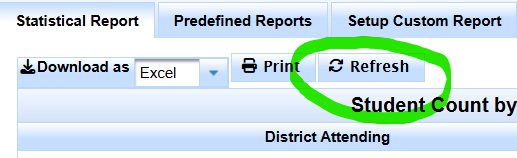
Refresh the report after the Found Set changes.
Use a Predefined Report
Predefined Reports are useful for common tasks. Some presets can apply search criteria as well as statistical-report settings, so confirm the resulting population before interpreting the counts.

Choose a predefined report for a common task or Setup Custom Reports for your own grouping.

Predefined reports provide commonly used search and report combinations.
Use Predefined Queries & Lists when you need more context about SIRAS presets that combine a population with a view/report.
Setup Custom Reports
Use Setup Custom Reports when the predefined reports do not answer your question.
Data Set
The Data Set determines the source records used by the report. The default uses your current Found Set. Other Data Set choices can alter the source population before the report is generated.

Data Set controls the records or source data used by the report.
Report Layout
| Layout | Best use |
|---|---|
| Grouped List | One or two grouping fields displayed in sections/rows. |
| Matrix | Exactly two grouping fields, with one dimension across rows and the other across columns. |
| Table | Three or more fields, or when each distinct combination should appear as its own row. |

Choose Grouped List, Matrix, or Table based on the number of fields being compared.
Count Records by One Field
- Confirm the intended Found Set.
- Open Reporting → Statistical Reports → Setup Custom Reports.
- Choose the intended Data Set.
- Add the field you want to count, such as Grade, School, Case Manager, Plan Type, or another available field.
- Use Grouped List or the available one-field layout.
- Select Generate Report.
Use this when the question is simply “How many records have each value?”
Compare Two Fields
- Confirm the intended Found Set.
- Add exactly two grouping fields.
- Choose Matrix when a row/column comparison makes the relationship easier to see.
- Generate the report and look for combinations or counts that stand out.
For example, comparing a program-related field with a placement or school-related field can make an unusual population visible before you inspect individual students.
Compare Three or More Fields
- Confirm the Found Set.
- Add the fields that describe the relationship you are trying to examine.
- Choose Table.
- Generate the report.
- If the result has too many unique rows, remove a highly specific field and regenerate the report to expose broader patterns.
- Once a combination stands out, return to a Student List to inspect the individual records.
Display Options
Show Labels / Codes
Choose Labels, Abbreviations, Codes, or Codes and Labels depending on how much detail fits the report.

Choose how labels, abbreviations, and codes appear in report results.
Show Percentages
Select Show Percentages when the percentage of the report population is useful in addition to the record count.

Show Percentages adds each grouping's percentage of the report population.
Service Reports
When the Data Set is Services, additional controls support service-focused analysis.
Service Code Filter
Use Service Code Filter when only particular service codes should be included.

When reporting on Services, Service Code Filter narrows the report to selected service codes.
Service Minutes Total
Use Service Minutes Total when the report should total service minutes by Daily or Monthly Minutes.

Service Minutes Total can total service data by daily or monthly minutes.
Generate a Graph
Select Generate Graph when a Pie, Vertical Bar, or Horizontal Bar graph will help communicate the results. The graph dimensions can be adjusted before generation.
The generated graph can be saved as an image for use in a document or presentation when allowed by local data-security practices.
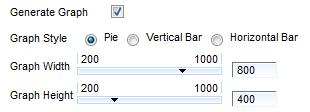
A Statistical Report can generate a graph and can be configured with selected grouping fields.
Choose Fields and Generate the Report
Add the fields you want to report on, arrange their order with the Up/Down controls, then select Generate Report.

Generate Report creates the report using the selected data set, layout, fields, and options.
Use Statistical Reports for Data Monitoring
Statistical Reports are strongest when the monitoring question is about patterns across a population: unexpected combinations, missing-value groups, unusual placement/program relationships, or counts that do not fit what the LEA expects.
For the actual data-quality checks to perform, use Data Quality Monitoring with Student Lists and Tables. Use Student List Help when a statistical pattern needs to be traced back to the individual students.
| Question | Best tool |
|---|---|
| Which students are selected? | Search / Query |
| What values do the individual students have? | Student List |
| How many records have each value or combination? | Statistical Report |
| What data-quality checks should I run? | Data Quality Monitoring |

