


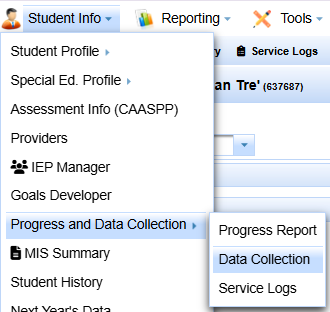
Go to /Student Info/Progress and Data Collection/Data Collection
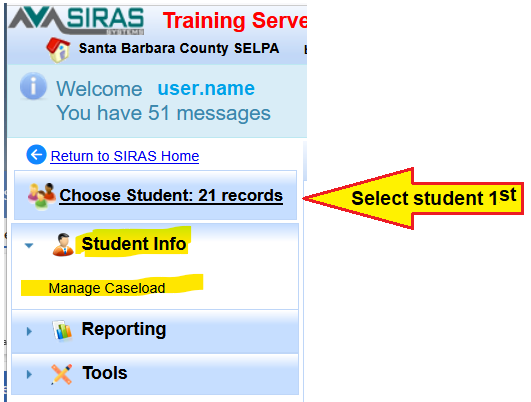
Why can't I see Progress and Data Collection?
Select at least one student before looking in Student Info menu for access.
 >>
>> 
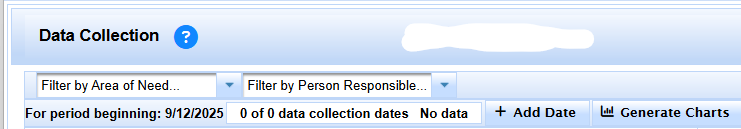
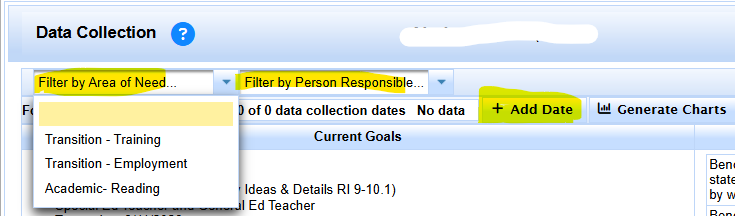
On the top left we can Filter by Area of Need and by Person Responsible
We can add a collection date
We can generate charts
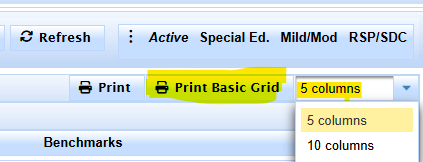
Then on the right hand side, look for the 'Print Basic Grid' [5 or 10 columns]
The Data Collection in SIRAS has two components:
1. Data Collection Grid
This will create a list of your goals and/or goals and benchmarks which can be printed out and used to collect data about the student’s progress. Above you would enter the date and in the boxes write the score that correlates with the date above and the goal/benchmark to the left.
2. Data Collection Chart
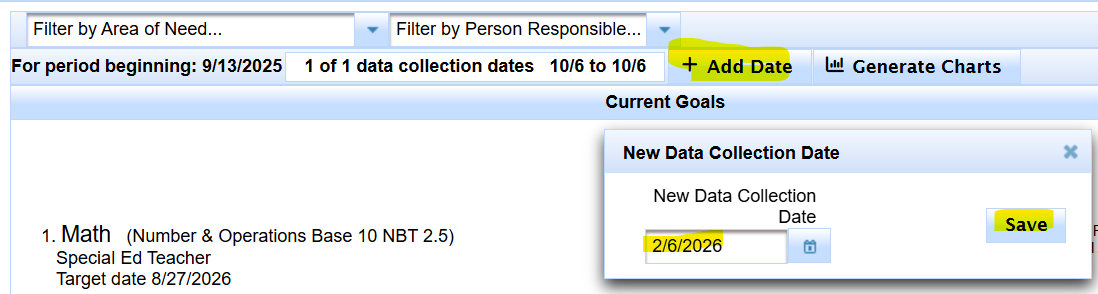
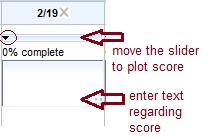
Using the Data Collection Chart will log and graph the student’s progress meeting their goals and/or goals and benchmarks. To use this feature after clicking on the ‘Add Data Collection Date’ you must enter the collection date. Then over to the right add a score and percentage of achieved by moving the slider. The slider generates percentage achieved that plots the point on the graph.
Click Add Date
Once a date has been added the % complete indicators come up.
When ready to create a graph click the “Generate Graph” button. You will see that each goal has a separate colored line. Click the “Print” button which will generate a printable version of the graph with the goals underneath.

